
Detect and contain machine-speed intrusions: what agentic attack frameworks change for your SOC
GTIG and Mandiant observed open-source multi-agent pentest frameworks inside live intrusions. Here is a defender's pass: pre-decide containment, detect velocity and sequences, and turn on the logs these tools actually leave.
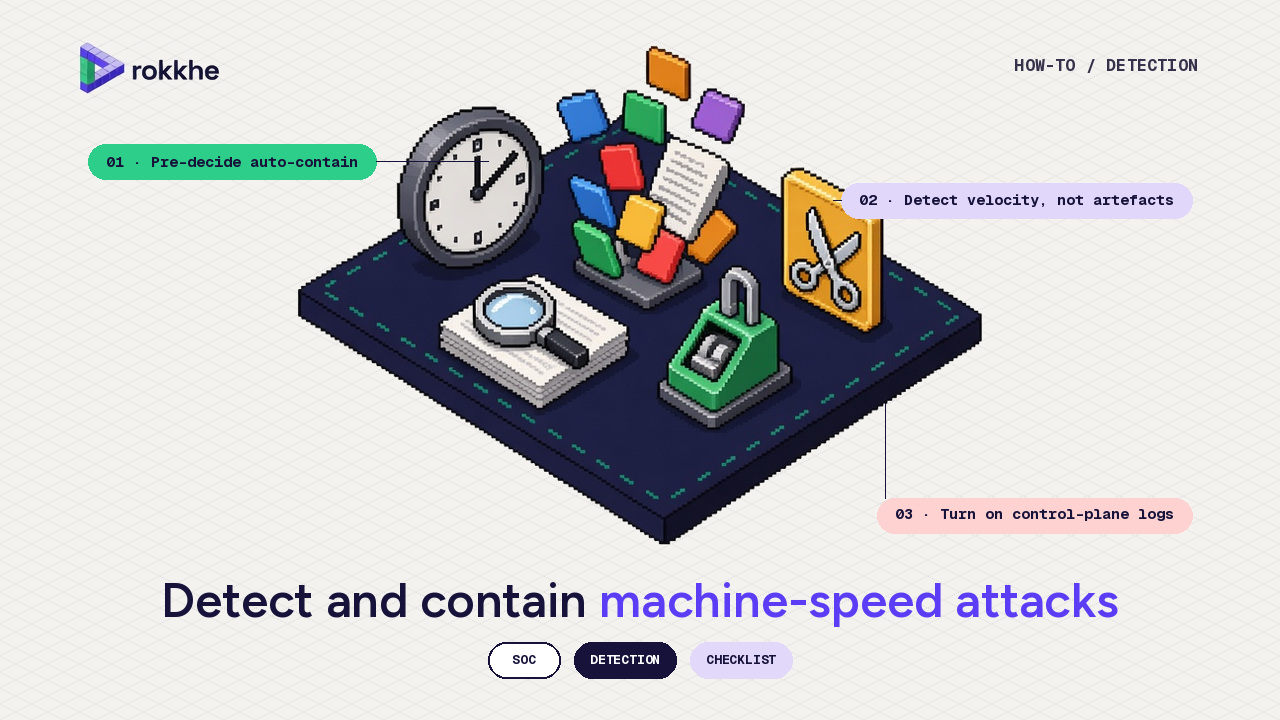
A defender's pass based on the October 2026 Google Threat Intelligence Group and Mandiant report. 16 November 2026, Asia/Dhaka. By the Rokkhe research team.
On 30 October 2026, Google Threat Intelligence Group (GTIG) and Mandiant published incident-response findings that deserved more attention than they got. Since late August 2026 they have watched threat actors run open-source, multi-agent pentest frameworks, including PentAGI, CAIRN, Hexstrike and other, possibly custom, harnesses, inside live Mandiant engagements. The agents were not limited to research demos. In those cases they carried out substantial parts of the attack lifecycle: lateral movement, database exploitation, and preparation for exfiltration.
The techniques are familiar: stolen credentials, unpatched systems, and living off the land. What changed is the clock. In one campaign in the report, the actor typically moved from the first compromised account to deep system access in around four hours, and in one case as rapidly as 15 minutes. Individual execution bursts ran for roughly 2 to 25 seconds. In one stretch the tooling performed 27 events in 23 seconds of active time, rapidly probing AWS permissions. Current public tools are still early and forensically noisy, and they already succeed often enough for crime-motivated actors to keep adopting them. PentAGI, which runs ordinary Kali Linux tools inside sandboxes, was mostly seen at scanning, though some operations reached intrusion and persistence. CAIRN and Hexstrike appear in the same engagements, with less case-level detail in this report, so we do not invent it here.
The playbooks and queries below are our working version of Mandiant's themes: control-plane isolation, short-lived credentials, least privilege, segmentation, and behavioural detection. They are examples. Tune the thresholds against your own baseline before you alert on them.
TL;DR
- Decide in advance which alert classes justify containment before a full investigation. A queue built for human dwell time will lose a 15-minute intrusion.
- Static indicators miss a lot of this. A valid service principal calling a supported management API looks ordinary when you inspect one event.
- Detect on velocity and on sequences: a burst of control-plane calls, permission probing followed by storage enumeration, authentication from an origin that identity has never used. Baseline legitimate automation first.
- Detection without a disruption path buys little. The report says this directly: detecting the attack in time does little to hinder objective completion. Measure time-to-containment, not only time-to-detect.
- Collect and retain non-interactive authentication, cloud control-plane activity, and sensitive data-plane logs. These frameworks are currently loud, but only if you collect the noise.
1. Pre-decide which alerts you will contain before you investigate
A single odd cloud authentication still gets queued in many SOCs because, historically, you had hours. If the next 20 minutes can be a complete privilege-discovery loop, that queue is the gap. This is a policy decision, not a tooling one. Write down, before the incident, which alert classes the on-call person may contain without waiting for a ticket that grants extra access.
| Alert class | Example signal | Contain first? | Immediate action |
|---|---|---|---|
| High-fidelity identity abuse | A service principal or access key signs in from an origin it has never used, then starts permission probing or storage enumeration | Yes, if it matches a pre-agreed playbook | Disable or rotate the credential, revoke sessions or tokens, then investigate |
| High-confidence endpoint isolation | Your EDR raises a high-severity isolation alert on a production host | Yes | Isolate the host, preserve volatile evidence, then investigate |
| Control-plane change from a new origin | Firewall, IAM, or Kudu/SCM (Azure App Service) admin access from a previously unseen network, followed by command execution or deployment | Yes, after a documented pre-approval for that identity class | Revoke the publishing or admin credential, then investigate |
| Single odd sign-in, no follow-on | One successful authentication from a new country or ASN, no burst, no permission probes | No | Queue for review, consider a step-up challenge, hunt in the surrounding hour |
| Low-fidelity volume spike | A CI role exceeds a raw API-count threshold that you have not baselined | No | Tune the baseline. Do not auto-disable the deploy role |
Name an owner for each row, name the system that will perform the action, and rehearse it. If killing a key or isolating a workload still requires a ticket and an approval chain to get elevated access, that is the gap the report points at when it separates detection from disruption.
2. Detect velocity and sequences, not only artefacts
Mandiant's detection layer is behavioural: identity velocity, API bursts, volumetric anomalies, and sequences. Tool names, hashes and IP addresses still help when you have them. They will not cover a legitimate service principal calling a normal management API. The report is explicit that detections like unusual bulk secret queries overlap with real pipelines, and that the signal is in the identity, origin, volume and sequence, not in the action alone. Baseline legitimate automation first.
Start with three patterns: a compressed burst of management API calls from one identity; successful authentication from a network, ASN or hosting provider that identity has never used, in a lookback you actually retain; and the sequence of a new origin, then permission probing, then storage enumeration, inside a short window. Treat that sequence as one incident, not three tickets. The queries below are labelled examples. Replace IDs and thresholds, and run them against a quiet week of your own logs before they become alerts.
Example: Entra service-principal sign-ins from a new IP (KQL)
Send these Entra diagnostic log categories to Log Analytics or Sentinel: SignInLogs, NonInteractiveUserSignInLogs, ServicePrincipalSignInLogs, and ManagedIdentitySignInLogs. The corresponding tables are SigninLogs, AADNonInteractiveUserSignInLogs, AADServicePrincipalSignInLogs, and AADManagedIdentitySignInLogs. In the Entra portal alone, sign-in logs are kept for 7 days on a Free licence and 30 days on P1 or P2. That is too short to baseline an identity. Export them.
// Example: successful service-principal sign-in from an IP not seen for this
// identity in the previous 30 days. ResultType 0 is success in this table.
let lookback = 30d;
let recent = 24h;
AADServicePrincipalSignInLogs
| where TimeGenerated > ago(lookback)
| where ResultType == 0
| where isnotempty(IPAddress) and isnotempty(ServicePrincipalId)
| summarize
    HistoricalIPs = make_set_if(IPAddress, TimeGenerated <= ago(recent), 200),
    RecentIPs = make_set_if(IPAddress, TimeGenerated > ago(recent), 50),
    RecentCount = countif(TimeGenerated > ago(recent))
    by ServicePrincipalId, ServicePrincipalName
| mv-expand RecentIP = RecentIPs to typeof(string)
| where RecentCount > 0
| where RecentIP !in (HistoricalIPs)
| project ServicePrincipalId, ServicePrincipalName, RecentIP, HistoricalIPs
Example: Azure control-plane bursts (KQL)
AzureActivity is the Azure resource-manager activity log. Useful fields include Caller, CallerIpAddress, OperationNameValue, CategoryValue, and ActivityStatusValue (values such as Succeeded and Failed).
// Example: a burst of Administrative control-plane operations in a 2-minute bin.
// 25 is a placeholder. Measure your deploy and Terraform roles first.
AzureActivity
| where TimeGenerated > ago(1d)
| where CategoryValue == "Administrative"
| where isnotempty(Caller)
| summarize
    CallCount = count(),
    DistinctOps = dcount(OperationNameValue),
    Operations = make_set(OperationNameValue, 20)
    by Caller, CallerIpAddress, bin(TimeGenerated, 2m)
| where CallCount >= 25
| order by CallCount desc
Example: AWS CloudTrail Lake, permission probing and API bursts
CloudTrail management events come with a trail or a Lake event data store. S3 object-level activity (GetObject, PutObject, DeleteObject) does not. You have to enable data events for the buckets that matter, typically with resource type AWS::S3::Object. Constrain eventTime so you do not scan the whole store.
EC2 accepts a DryRun flag that checks permissions without performing the action. If the caller is allowed, the API returns DryRunOperation; if not, UnauthorizedOperation. In CloudTrail this often appears as errorCode Client.DryRunOperation or DryRunOperation. The report describes rapid permission testing of this kind, including DryRun checks against EC2, EBS and snapshots.
-- Example: DryRun permission probes, plus a 1-minute API burst per identity.
-- Replace EVENT_DATA_STORE_ID and the timestamps. Run separately in CloudTrail Lake.

SELECT eventTime, userIdentity.arn, eventName, errorCode, sourceIPAddress, userAgent
FROM EVENT_DATA_STORE_ID
WHERE eventTime >= '2026-11-15 00:00:00'
  AND eventTime <  '2026-11-16 00:00:00'
  AND eventSource = 'ec2.amazonaws.com'
  AND errorCode IN ('DryRunOperation', 'Client.DryRunOperation');

SELECT
    date_trunc('minute', eventTime) AS minute,
    userIdentity.arn,
    sourceIPAddress,
    count(*) AS api_calls,
    array_agg(DISTINCT eventName) AS events
FROM EVENT_DATA_STORE_ID
WHERE eventTime >= '2026-11-15 00:00:00'
  AND eventTime <  '2026-11-16 00:00:00'
  AND userIdentity.arn IS NOT NULL
GROUP BY 1, 2, 3
HAVING count(*) >= 25
ORDER BY api_calls DESC;
A compact Sigma form of the DryRun probe, for teams that convert into a SIEM. This is an example rule, not a published SigmaHQ rule. Legitimate infrastructure-as-code often sets DryRun=true, so baseline before you raise the level.
title: AWS EC2 Permission Probing via DryRun
description: Detects EC2 API calls that failed with a DryRun error code, which is how a caller can test permissions without performing the action.
references:
    - https://docs.aws.amazon.com/AWSEC2/latest/APIReference/API_RunInstances.html
author: Rokkhe research team
date: 2026-11-16
logsource:
    product: aws
    service: cloudtrail
detection:
    selection:
        eventSource: 'ec2.amazonaws.com'
        errorCode:
            - 'DryRunOperation'
            - 'Client.DryRunOperation'
    condition: selection
falsepositives:
    - Automation and IaC tools that call the EC2 API with DryRun set to true
level: medium
Example: GCP Admin Activity bursts (Log Analytics SQL)
Admin Activity audit logs (log_id("cloudaudit.googleapis.com/activity")) are on by default and cannot be turned off. Data Access audit logs (log_id("cloudaudit.googleapis.com/data_access")) are off by default and must be enabled per service. Useful fields are protoPayload.authenticationInfo.principalEmail, protoPayload.methodName, and protoPayload.requestMetadata.callerIp. The query below is for Cloud Logging Log Analytics. Replace the table name.
-- Example: Admin Activity bursts in a 1-minute bin.
-- Replace PROJECT_ID.LOCATION.BUCKET_ID (often PROJECT_ID.global._Default).
SELECT
  TIMESTAMP_TRUNC(timestamp, MINUTE) AS minute,
  proto_payload.audit_log.authentication_info.principal_email AS principal,
  proto_payload.audit_log.request_metadata.caller_ip AS caller_ip,
  COUNT(*) AS calls,
  ARRAY_AGG(DISTINCT proto_payload.audit_log.method_name LIMIT 20) AS methods
FROM `PROJECT_ID.LOCATION.BUCKET_ID._AllLogs`
WHERE timestamp >= TIMESTAMP_SUB(CURRENT_TIMESTAMP(), INTERVAL 24 HOUR)
  AND log_id = "cloudaudit.googleapis.com/activity"
  AND proto_payload.audit_log.authentication_info.principal_email IS NOT NULL
GROUP BY 1, 2, 3
HAVING calls >= 25
ORDER BY calls DESC;
Correlate those building blocks. A new origin, then a control-plane burst that includes GetIamPolicy, SimulatePrincipalPolicy, GetCallerIdentity, DryRun failures, or storage.objects.list, then a jump in GetObject or Data Access reads, is the sequence the report describes. Do not wait for a malware hash before you treat it as urgent.
3. Measure time-to-containment, not only time-to-detect
The most uncomfortable line in the report is also the plainest. Detection and disruption are different functions. Simply detecting the attack in time does little to hinder objective completion.
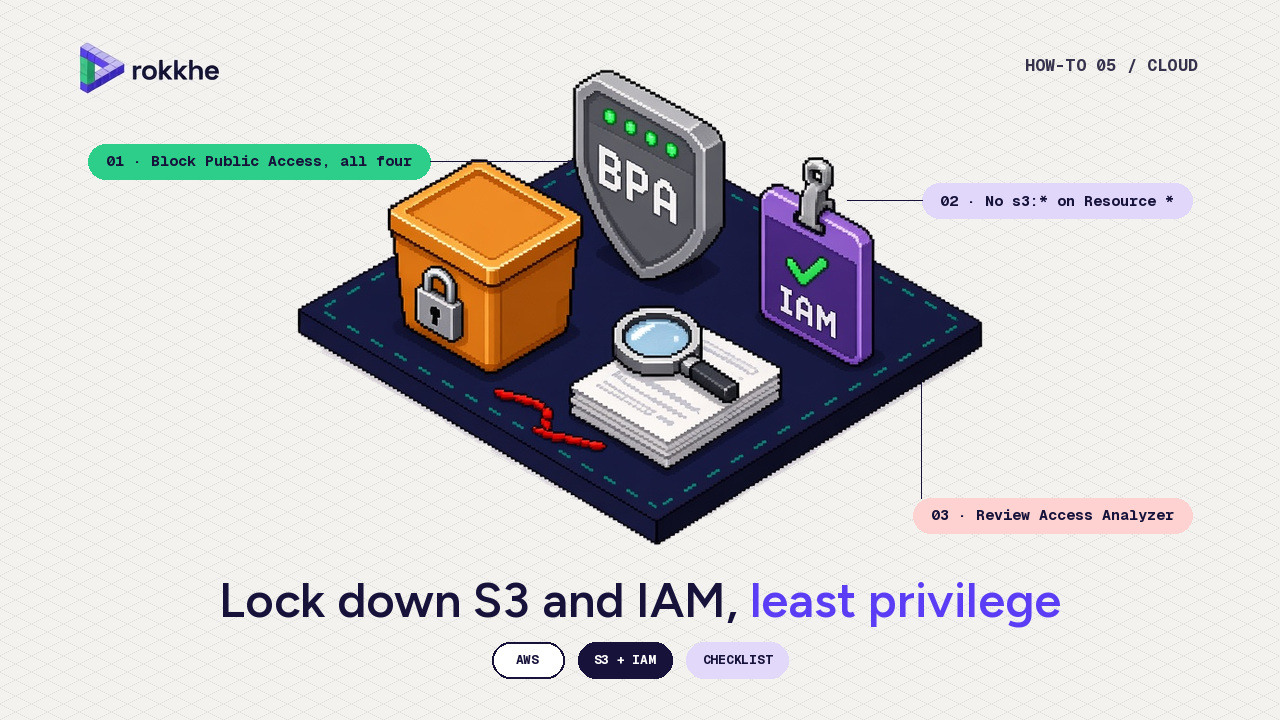
Put a clock on the actions that actually stop the path: disable or rotate the access key, client secret, publishing profile or SAS token; revoke sessions; isolate the workload or revoke its instance profile, managed identity or service-account key; close a management path that should not have been on the internet. Track the time from first high-fidelity alert to the moment the credential or host is actually dead. If that number includes an approval wait, shorten the wait for the pre-agreed alert classes, or pre-stage a break-glass role that the on-call person already has, with logging on every use. Tightening S3 and IAM to least privilege still matters: a stolen identity that can only list one prefix is a slower incident than one with s3:* on *.
4. Turn on the logs these attacks leave, and put a few canaries where they probe
You cannot baseline an identity you never recorded. Start with the surfaces the report calls out: programmatic authentication, control-plane APIs, and sensitive storage access.
| Surface | What to turn on | Default you should not trust |
|---|---|---|
| Microsoft Entra | Diagnostic settings for SignInLogs, NonInteractiveUserSignInLogs, ServicePrincipalSignInLogs, ManagedIdentitySignInLogs, and AuditLogs, exported to Log Analytics, storage, or Sentinel |
7 or 30 days in the Entra portal, depending on licence. Export if you want a baseline |
| AWS control plane | A CloudTrail trail or Lake event data store covering management events in every region you use | Event history is only 90 days and is not a full archive |
| AWS data plane | CloudTrail data events for sensitive S3 buckets (AWS::S3::Object: GetObject, PutObject, DeleteObject) |
Off until you enable them. Management events will not show object reads |
| GCP control plane | Admin Activity logs, already on. Keep them, and set retention and routing yourself | On by default |
| GCP data plane | Data Access audit logs (DATA_READ, DATA_WRITE, and often ADMIN_READ) for sensitive services first: storage.googleapis.com, secretmanager.googleapis.com, iam.googleapis.com, cloudkms.googleapis.com, and your databases |
Off by default. Enabling allServices DATA_READ can be expensive; start with credentials and customer data |
Retain enough history to say "this identity has never used that ASN." Thirty days is a starting point. Keep the logs somewhere the SOC can query at 2 a.m.
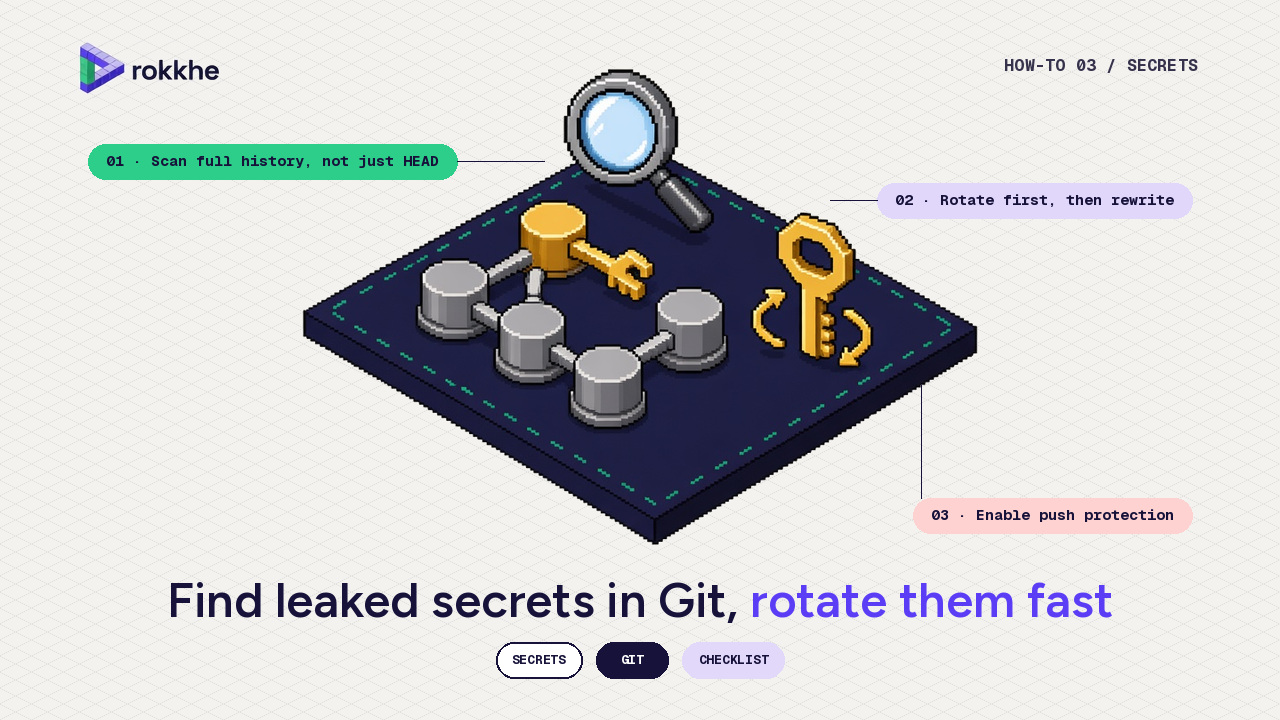
A cheap complement, which is our suggestion rather than a finding from the report, is to put canary credentials where these frameworks already look: environment variables, application config files, and secret stores. An agent that tests every credential it finds has no instinct for a secret that is too convenient. Thinkst Canarytokens can issue an AWS API token, an Azure login, a kubeconfig, or a custom document that phones home when it is used. You can also create a dedicated cloud identity with no useful permissions and alert on its first authentication. If you already scan git for leaked secrets, as in the earlier post in this series, keep canaries out of real repositories, or you will rotate them by accident.
The current tools are loud, if you collect the noise
GTIG's assessment is that these frameworks currently trade stealth for speed. Unrestricted autonomous execution generates forensic traffic, uses recognisable identifiers, and leaves code-level traces. In the incidents they describe, that noise had a shape:
- Compressed bursts of a few seconds, including 27 events in 23 seconds of permission probing.
- A single operation that produced 240 log events while iterating toward command execution, with errors that looked like multiple sub-agents overwriting one another on the same objective.
- Incrementally named webshell candidates (for example
cl1217.jsp,f1219a.jsp,z1219.jsp) and incremental numeric markers in dropped file names, account names, passwords, and email subjects.
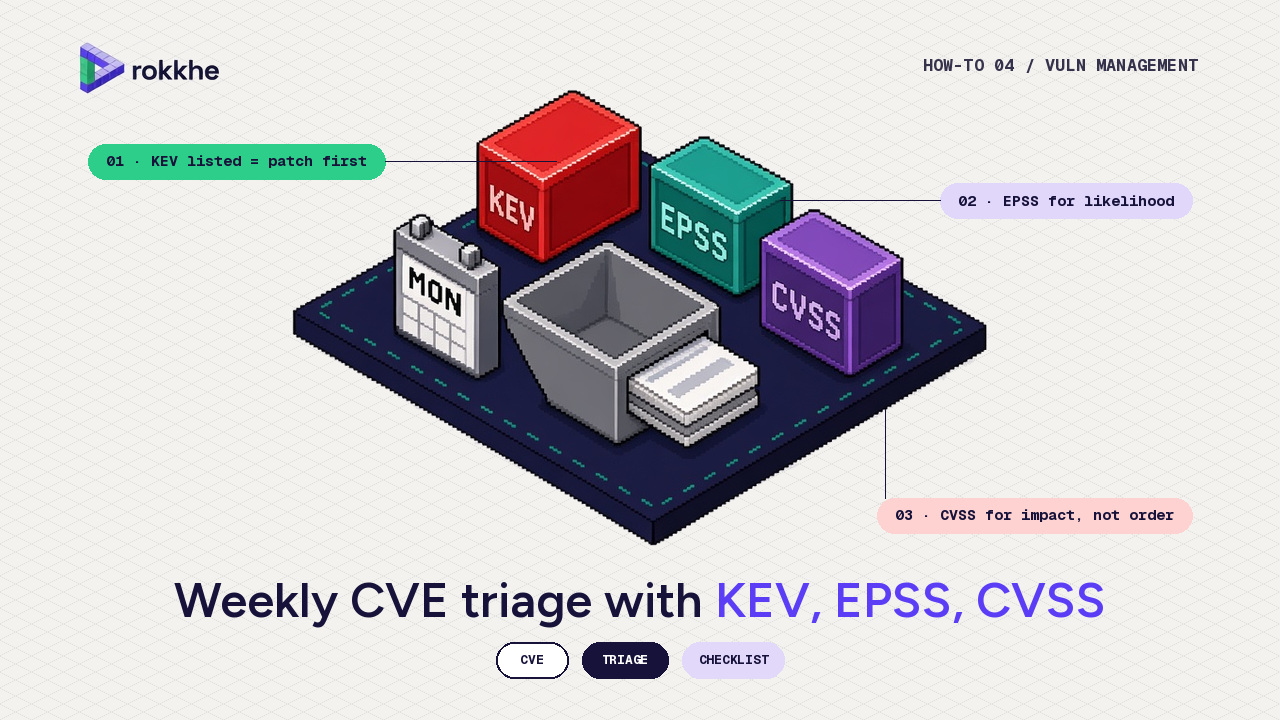
Hundreds of events in one messy attempt are only an advantage if those events land in a store you retain and in a detection you actually run. The same pass you use for weekly CVE triage with KEV, EPSS and CVSS can include a monthly check that these log sources are still on, still arriving, and still old enough to baseline against.
Checklist
- A written containment policy lists which alert classes the on-call person may act on before a full investigation, with an owner and a rehearsed action.
- Time-to-containment is measured for credential revocation and workload isolation, not only time-to-detect.
- Killing a key or isolating a host does not wait on an ad hoc access request for the pre-agreed classes.
- Entra non-interactive, service-principal and managed-identity sign-ins are exported, not left in the 7- or 30-day portal window.
- Cloud control-plane logs are centralised (CloudTrail management events, Azure Activity, GCP Admin Activity).
- Sensitive data-plane logs are on (S3 data events, GCP Data Access for storage and secrets, equivalent storage logs in Azure).
- At least one velocity rule and one new-origin rule exist for programmatic identities, baselined against known automation.
- Sequences (new origin, then permission probing, then storage enumeration) are triaged as one incident.
- Canary credentials sit in an environment variable, a config file, or a secret store, with an alert on first use.
- Internet-facing management interfaces (cloud admin, CI/CD, Kudu/SCM, firewall consoles) are restricted to trusted paths.
Sources
- Google Threat Intelligence Group and Mandiant, Enter Agentic Offensive Frameworks, Google Cloud Blog, 30 October 2026. Authors: Aurora Blum, David Mainor, Rohit Nambiar, Omar ElAhdan, Matthew McWhirt, Will Silverstone, Bhavesh Dhake and Chris Busse. The report sits in the Threat Intelligence section of the Google Cloud Blog; we do not reproduce a URL here.
- Microsoft Learn, Microsoft Entra data retention, Logs available for streaming from Microsoft Entra ID, AADServicePrincipalSignInLogs, and AzureActivity
- AWS Docs, Logging data events with CloudTrail, CloudTrail Lake queries, and EC2 RunInstances DryRun
- Google Cloud Docs, Understanding audit logs, Enable Data Access audit logs, and Query audit logs with Log Analytics
This post sits outside the ten-part how-to series, but it leans on three of those pieces: weekly CVE triage with KEV, EPSS and CVSS, locking down S3 and IAM, and finding and rotating leaked secrets in Git.
Rokkhe runs agentic pentests and builds detection rules from proven exploits. Learn more at rokkhe.com.
Comments
Join the discussionNo comments yet. Be the first to comment.